Everything written about what this stack costs is either a pricing page or somebody's guess. A pricing page tells you the rate; it cannot tell you the quantity, and the quantity is the part nobody publishes. So here is a month of mine, measured rather than estimated.
What is actually running
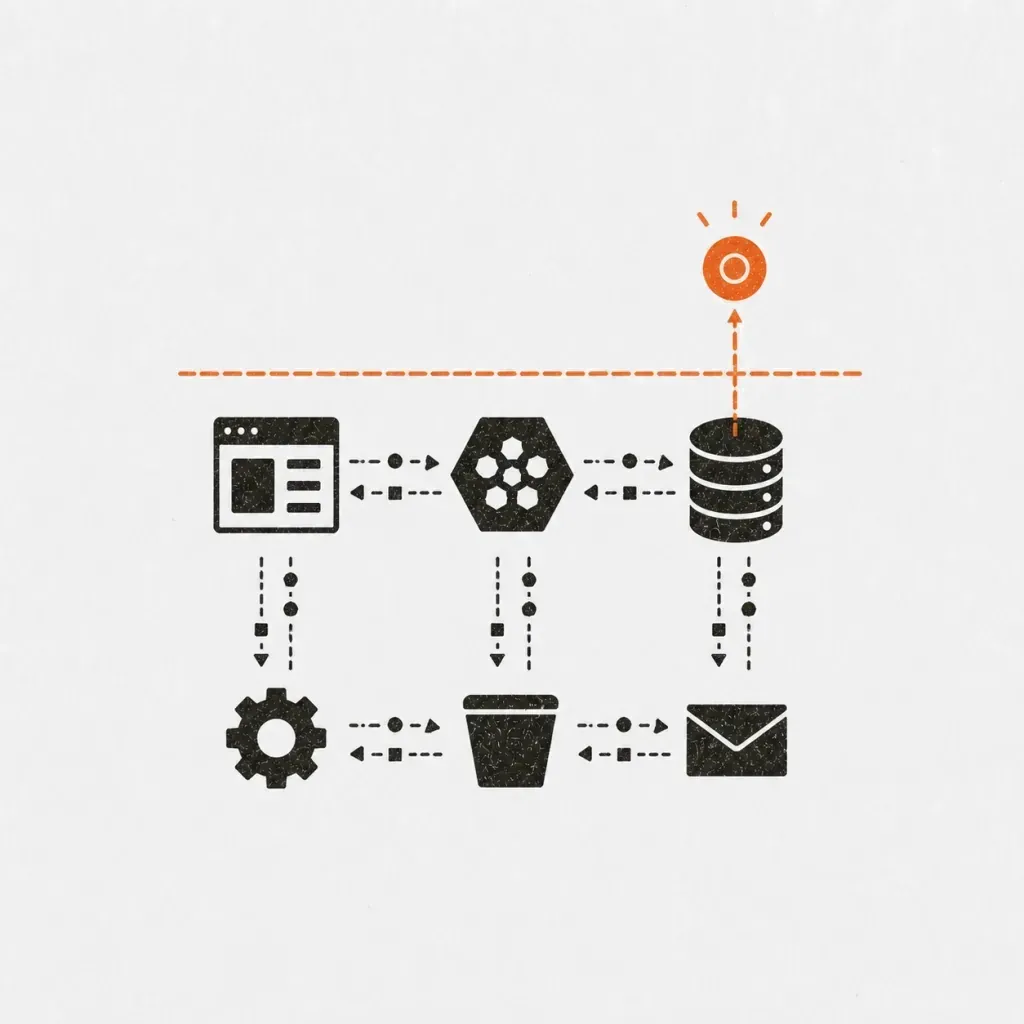
Six Cloudflare products, none of them decorative:
- Workers — renders every page and answers the MCP endpoint.
- D1 — 29 tables. Seat requests, subscribers, reviews, comments, the crawler log, client errors.
- R2 — the private profile photographs attached to seat requests.
- Durable Objects — the live reader count on a field note.
- Cron Triggers — one job an hour that sends and retries event mail.
- Assets — the static half of the site, which never reaches the Worker at all.
The site is twenty-eight pages with no meaningful human traffic. That is the point of the exercise: this is the floor, not a load test.
The measurements
Taken today, from the platform's own reporting rather than from an estimate.
- D1 storage: 1.07 MB across 29 tables.
- D1 in 24 hours: 3,771 read queries and 1,172 write queries, moving 151,897 rows read and 1,936 rows written.
- R2: one object, 138 kB.
- Crawler requests: 3,282 over thirty-three days, from fifteen named bots.
- Referral visits: 2,108 in the same window — almost all of them mine.
Scaled to a month, that is roughly 4.56 million rows read and 58,000 written.
A hundred and fifty thousand rows a day, on a site whose logs record about five thousand requests a month.
Against what the plan includes
Cloudflare publishes the allowances. I fetched them while writing this rather than trusting a number I remembered: the Workers paid plan is $5 a month per account and includes 10 million requests and 30 million CPU-milliseconds. D1 on that plan includes 25 billion rows read, 50 million rows written, and 5 GB of storage. R2 includes 10 GB-months and a million class A operations. Durable Objects include a million requests and 400,000 GB-seconds.
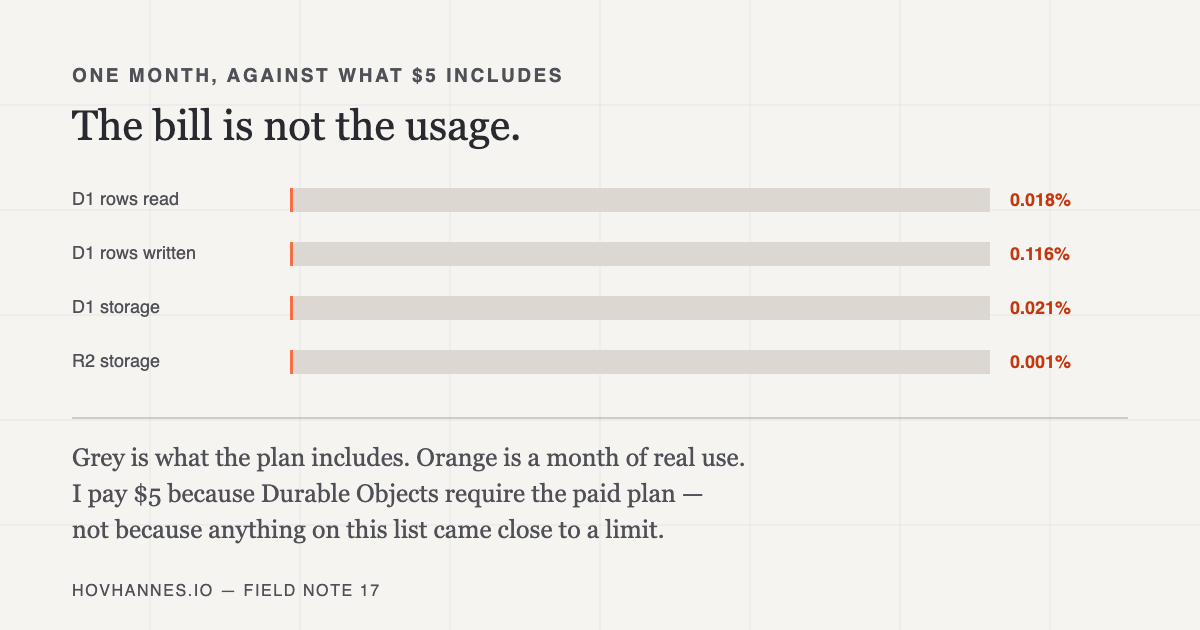
Put beside each other:
| Resource | Used in a month | Included | Share |
|---|---|---|---|
| D1 rows read | 4.56 million | 25 billion | 0.018% |
| D1 rows written | 58,000 | 50 million | 0.116% |
| D1 storage | 1.07 MB | 5 GB | 0.021% |
| R2 storage | 138 kB | 10 GB | 0.001% |
The largest of those is one part in 861. The smallest is one part in seventy-six thousand. Nothing here is close to a meter, which means nothing here is what I am paying for.
Where the work comes from, since it is not visitors
A hundred and fifty thousand rows a day has to come from somewhere, and it is not people reading. I measured the recurring queries individually and none of them is expensive:
- The table schedule, read on every
/eventsload and every agent asking for dates — 9 rows. - Seat availability, the second half of that same answer — 8 rows.
- One article's like, comment and share counts — 32 rows.
- The batched version for the home page and the index — 59 rows.
- The hourly job asking whether any email needs retrying — 4 rows.
So the volume is not weight, it is frequency. Three thousand seven hundred read queries a day is about one every twenty-three seconds, and almost none of them were started by a person. They come from the hourly job, from the site recording every crawler request it receives, and from counters that render whether or not anyone is looking.
The database is busiest doing bookkeeping about a site nobody is currently reading. That is not a fault — it is what instrumentation is — but it is worth knowing before you conclude your usage tracks your audience. Mine does not. A quarter of the crawler traffic it dutifully logs was not even a crawler.
What the five dollars is actually buying
Here is the part that changes how you choose.
Nothing on that table would cost me anything. Every one of those numbers fits inside the free tier as well, several times over. I pay $5 a month because Durable Objects require the paid plan — and the only thing this site uses a Durable Object for is showing how many people are reading a field note at the same moment.
The actual decision
A live reader count moved this site from nothing to five dollars a month. The database, the object storage, the scheduled job and the MCP server were all free and remain free.That is the shape of the bill on a small product: not a meter that climbs with success, but a threshold you cross the first time you reach for one particular primitive. Six products, and one of them decided the price.
Which makes the useful question at planning time not “what will this cost at scale”, but “which of these choices has a floor under it”. A feature that needs a Durable Object costs five dollars whether it is used once or a million times. That is cheap, and it is still a different kind of decision from one that costs nothing until it is popular — the sort of thing worth naming in the dependency list before the plan is written, because it is much harder to notice afterwards.
What I am not claiming
The usage figures are a rolling twenty-four hour window, read on a working day — one where I was deploying to this site and testing it. Reading the same counter a few hours later gave 160,774 rows instead of 151,897, which is the right order of drift for a window that keeps moving. Nothing in the argument turns on the exact figure; if it did, one reading would be the wrong way to make it.
One of those numbers was measuring me. The visit counter reported 2,108 arrivals in thirty-three days, which sits oddly beside the claim that nobody visits — and the oddness was the tell. It counted any request shaped like a page load, and this build's own link checker walks every page on every deploy. In the sixteen days before I started this round of work it recorded six visits a day. In the six days of the work itself, three hundred and seventy-five. It now requires the headers a browser actually sends, ignores the ones marked as prefetch, and ignores me. The old figure is not worth rescuing, and I have left it above rather than quietly restating it, because a counter that spent a week counting its own toolchain is the more useful thing to have found.
I have not shown you an invoice. What I measured is usage, from the platform's own reporting, and what I checked it against is Cloudflare's published pricing, fetched today. The arithmetic between those two is mine, and an invoice can contain things arithmetic does not — a plan I forgot I was on, a product I am not counting, a rate that changed after this was written.
The measurements are also one site's, and a small one. A product with real traffic has a different profile: requests and CPU-milliseconds start to matter, and rows read climbs with readers rather than with cron. Nothing here says the platform is cheap at scale. It says something narrower and more useful to somebody starting: at this size the meter is not the thing to plan around, and the threshold is.
The one number I would carry to another project is not a price. It is 151,897 — the reminder that a quiet site is not an idle one, and that if you ever do end up paying by the row, most of them will have been read on nobody's behalf.
Further reading
Primary sources behind this note
Reader response
Was this field note useful?
Build on what you can verify
Want the same clarity about your product?
Apply for a Clarity SprintField notes by email
Thanks, you're on the list. ✓
Email signup did not go through. Please try again.
A short note when there is something worth sharing. No spam.